#include <QApplication>
#include "jkqtplotter/jkqtplotter.h"
#include "jkqtplotter/graphs/jkqtpbarchart.h"
#define Ndata 5
int main(int argc, char* argv[])
{
QApplication app(argc, argv);
QVector<double> year, percentage_other, percentage_coaloil, percentage_gas, percentage_nuclear, percentage_green;
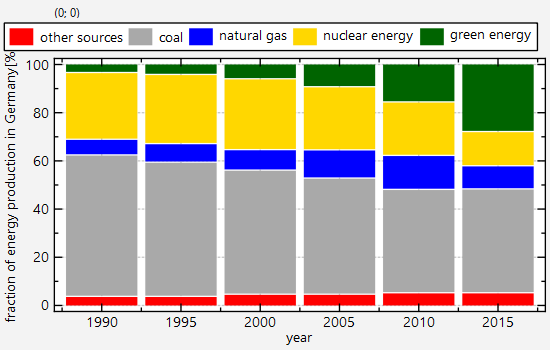
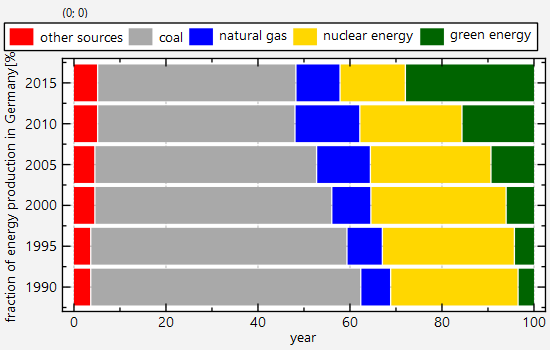
year << 1990 << 1995 << 2000 << 2005 << 2010 << 2015;
percentage_other << 3.5 << 3.5 << 4.4 << 4.4 << 5 << 5 ;
percentage_coaloil << 58.7 << 55.7 << 51.5 << 48.2 << 42.9 << 43.1;
percentage_gas << 6.5 << 7.7 << 8.5 << 11.7 << 14.1 << 9.6 ;
percentage_nuclear << 27.7 << 28.7 << 29.4 << 26.2 << 22.2 << 14.2;
percentage_green << 3.6 << 4.4 << 6.2 << 9.5 << 15.8 << 28.1;
QVector<JKQTPBarVerticalStackableGraph*> graphs;
graphs.back()->setXColumn(cYear);
graphs.back()->setYColumn(cOther);
graphs.back()->setTitle(QObject::tr("other sources"));
graphs.back()->setFillColor_and_darkenedColor(QColor("red"));
graphs.back()->setXColumn(cYear);
graphs.back()->setYColumn(cCoalOil);
graphs.back()->setTitle(QObject::tr("coal & oil"));
graphs.back()->setFillColor_and_darkenedColor(QColor("darkgrey"));
graphs.back()->stackUpon(graphs[graphs.size()-2]);
graphs.back()->setXColumn(cYear);
graphs.back()->setYColumn(cGas);
graphs.back()->setTitle(QObject::tr("natural gas"));
graphs.back()->setFillColor_and_darkenedColor(QColor("blue"));
graphs.back()->stackUpon(graphs[graphs.size()-2]);
graphs.back()->setXColumn(cYear);
graphs.back()->setYColumn(cNuclear);
graphs.back()->setTitle(QObject::tr("nuclear energy"));
graphs.back()->setFillColor_and_darkenedColor(QColor("gold"));
graphs.back()->stackUpon(graphs[graphs.size()-2]);
graphs.back()->setXColumn(cYear);
graphs.back()->setYColumn(cGreen);
graphs.back()->setTitle(QObject::tr("green energy"));
graphs.back()->setFillColor_and_darkenedColor(QColor("darkgreen"));
graphs.back()->stackUpon(graphs[graphs.size()-2]);
plot.show();
plot.resize(600,400);
return app.exec();
}
void setUseAntiAliasingForSystem(bool __value)
specifies whether to use antialiasing for plotting the coordinate system
void setUseAntiAliasingForGraphs(bool __value)
specifies whether to use antialiasing for plotting the graphs
void setKeyPosition(const JKQTPKeyPosition &__value)
key position inside or besides the plot area, see JKQTPKeyPositions for details and examples
void setUseAntiAliasingForText(bool __value)
specifies whether to use antialiasing when drawing any text
This implements a vertical bar graph with bars between and Optionally several graphs of this type m...
Definition jkqtpbarchart.h:268
void setAxisLabel(const QString &__value)
axis label of the axis
This class manages data columns (with entries of type double ), used by JKQTPlotter/JKQTBasePlotter t...
Definition jkqtpdatastorage.h:282
size_t addCopiedColumn(QVector< double > &&data, const QString &name)
add a column with data from data, ownership of the memory behind data is transfered to the datastore
Definition jkqtpdatastorage.h:798
plotter widget for scientific plots (uses JKQTBasePlotter to do the actual drawing)
Definition jkqtplotter.h:374
void zoomToFit(bool zoomX=true, bool zoomY=true, bool includeX0=false, bool includeY0=false, double scaleX=1.05, double scaleY=1.05)
this method zooms the graph so that all plotted datapoints are visible.
Definition jkqtplotter.h:1051
void addGraphs(const TJKQTPGraphContainer &gr, QVector< size_t > *graphIDsOut=nullptr)
add a new graphs from a QVector<JKQTPPlotElement*>, QList<JKQTPPlotElement*>, std::vector<JKQTPPlotEl...
Definition jkqtplotter.h:828
JKQTPVerticalAxisBase * getYAxis(JKQTPCoordinateAxisRef axis=JKQTPPrimaryAxis)
returns the y-axis objet of the plot
Definition jkqtplotter.h:725
JKQTBasePlotter * getPlotter()
returns the JKQTBasePlotter object internally used for plotting
Definition jkqtplotter.h:414
JKQTPDatastore * getDatastore()
returns a pointer to the datastore used by this object
Definition jkqtplotter.h:621
JKQTPHorizontalAxisBase * getXAxis(JKQTPCoordinateAxisRef axis=JKQTPPrimaryAxis)
returns the x-axis objet of the plot
Definition jkqtplotter.h:723
@ JKQTPKeyLayoutOneRow
the key consists of one row. This may overflow the available space, use JKQTPKeyLayoutMultiColumn or ...
Definition jkqtptools.h:639
@ JKQTPKeyOutsideTopRight
the key is positioned above the graph, on the right
Definition jkqtptools.h:559