#include <QApplication>
#include <cmath>
#include "jkqtplotter/jkqtplotter.h"
#include "jkqtplotter/graphs/jkqtpimagergb.h"
#ifndef M_PI
#define M_PI 3.14159265358979323846
#endif
int main(int argc, char* argv[])
{
QApplication app(argc, argv);
const int NX=100;
const int NY=100;
const double dx=1e-2;
const double dy=1e-2;
const double w=static_cast<double>(NX)*dx;
const double h=static_cast<double>(NY)*dy;
double airydisk1[NX*NY];
double airydisk2[NX*NY];
double NA=1.1;
double wavelength1=540e-3;
double wavelength2=450e-3;
double x, y=-h/2.0;
for (int iy=0; iy<NY; iy++ ) {
x=-w/2.0;
for (int ix=0; ix<NX; ix++ ) {
const double r=sqrt(x*x+y*y);
const double v1=2.0*M_PI*NA*r/wavelength1;
airydisk1[iy*NX+ix] = sqrt(pow(2.0*j1(v1)/v1, 2));
const double v2=2.0*M_PI*NA*r/wavelength2;
airydisk2[iy*NX+ix] = sqrt(pow(2.0*j1(v2)/v2, 2));
x+=dx;
}
y+=dy;
}
plot.show();
plot.resize(600,600);
plot.setWindowTitle("JKQTPColumnRGBMathImage");
return app.exec();
}
void setMaintainAspectRatio(bool value)
en-/disables the maintaining of the data aspect ratio
void setUseAntiAliasingForSystem(bool __value)
specifies whether to use antialiasing for plotting the coordinate system
void setMaintainAxisAspectRatio(bool value)
en-/disables the maintaining of the axis aspect ratio
void setUseAntiAliasingForGraphs(bool __value)
specifies whether to use antialiasing for plotting the graphs
void setUseAntiAliasingForText(bool __value)
specifies whether to use antialiasing when drawing any text
like JKQTPRGBMathImage but reads images from columns of the datastore
Definition jkqtpimagergb.h:490
virtual void setImageBColumn(int __value)
image column for B channel
virtual void setImageGColumn(int __value)
image column for G channel
void setAxisLabel(const QString &__value)
axis label of the axis
This class manages data columns (with entries of type double ), used by JKQTPlotter/JKQTBasePlotter t...
Definition jkqtpdatastorage.h:223
size_t addCopiedImageAsColumn(const T *data, size_t width, size_t height, const QString &name=QString(""), size_t stride=1, size_t start=0)
add one external column to the datastore. It contains width * height rows. The external data is assum...
Definition jkqtpdatastorage.h:2650
void setHeight(double __value)
height of image
void setX(double __value)
x coordinate of lower left corner
void setWidth(double __value)
width of image
void setY(double __value)
y coordinate of lower left corner
void setNy(int __value)
height of the data array data in pt
void setNx(int __value)
width of the data array data in pt
JKQTPVerticalIndependentAxis * getColorBarRightAxisG()
object used for color bar axes (right border, green image data)
JKQTPVerticalIndependentAxis * getColorBarRightAxisB()
object used for color bar axes (right border, blue image data)
virtual void setTitle(const QString &title) override
sets the title of the plot (for display in key!).
void setAutoImageRange(bool __value)
indicates whether to estimate min/max of the image automatically
plotter widget for scientific plots (uses JKQTBasePlotter to do the actual drawing)
Definition jkqtplotter.h:374
void zoomToFit(bool zoomX=true, bool zoomY=true, bool includeX0=false, bool includeY0=false, double scaleX=1.05, double scaleY=1.05)
this method zooms the graph so that all plotted datapoints are visible.
Definition jkqtplotter.h:1051
JKQTPVerticalAxisBase * getYAxis(JKQTPCoordinateAxisRef axis=JKQTPPrimaryAxis)
returns the y-axis objet of the plot
Definition jkqtplotter.h:725
JKQTBasePlotter * getPlotter()
returns the JKQTBasePlotter object internally used for plotting
Definition jkqtplotter.h:414
size_t addGraph(JKQTPPlotElement *gr)
Definition jkqtplotter.h:796
JKQTPDatastore * getDatastore()
returns a pointer to the datastore used by this object
Definition jkqtplotter.h:621
JKQTPHorizontalAxisBase * getXAxis(JKQTPCoordinateAxisRef axis=JKQTPPrimaryAxis)
returns the x-axis objet of the plot
Definition jkqtplotter.h:723
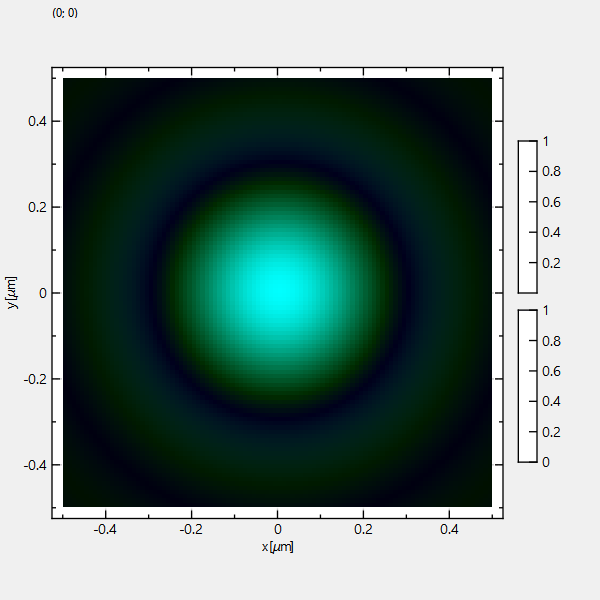
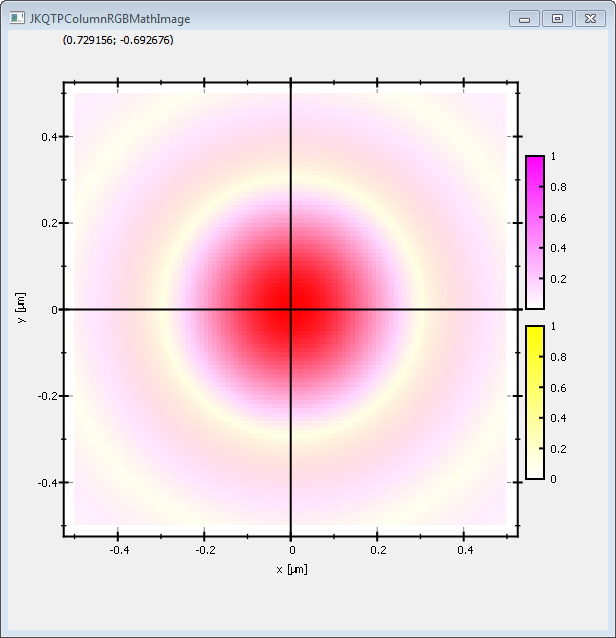
In the example above, we calculated two airy disks for two wavelengths and assigned them to the R and G color channel of the output image. Alternatively you can also assign them to the CMY-channels of the output image:
Note that the CMY-color model is a subtractive color model, whereas RGB is an additive model. Therefore CMY-color-scales range from CMY to white, whereas the RGB-scales range from RGB to black!