|
JKQTPlotter trunk/v5.0.0
an extensive Qt5+Qt6 Plotter framework (including a feature-richt plotter widget, a speed-optimized, but limited variant and a LaTeX equation renderer!), written fully in C/C++ and without external dependencies
|
|
JKQTPlotter trunk/v5.0.0
an extensive Qt5+Qt6 Plotter framework (including a feature-richt plotter widget, a speed-optimized, but limited variant and a LaTeX equation renderer!), written fully in C/C++ and without external dependencies
|
This project (see ./examples/parsedfunctionplot/) demonstrates how to plot mathematical functions as line graphs. The functions are defined as strings that will be evaluated with the equation parser, integrated into JKQTPlotter.
Note: See the example Plotting Mathematical Functions as Line Graphs if you don't want to draw parsed functions, but want to provide a C function, or C++ functor!
Adding an evaluated funtion to a graph is very simple:
As you can see a graph of the type JKQTPXParsedFunctionLineGraph is used, which plots a function that depends on the variable x. The given function is parsed and evaluated (see lib/jkqtcommon/jkqtpmathparser.h for details on the features of the math parser). An intelligent drawing algorithm chooses the number of control points for drawing a smooth graph, with sufficient amount of details, by evaluating locally the slope of the function.
In the example in examples/parsedfunctionplot/parsedfunctionplot.cpp we do not simply set a fixed function, but add a QLineEdit which allows to edit the function and redraws it, once ENTER is pressed:
This code snippet results in a plot like this:
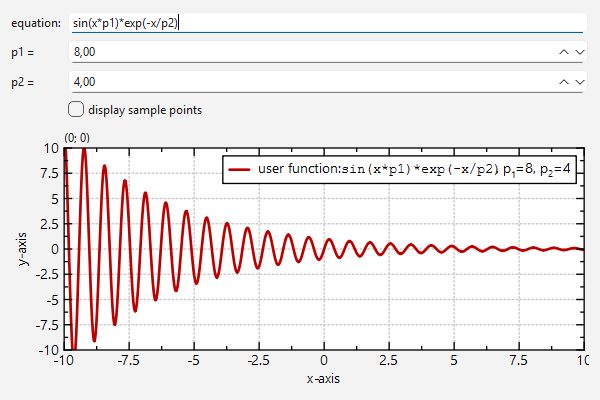
As shown in Plotting Mathematical Functions as Line Graphs you can also use externally set parameters in a plot function. These parameters can be double numbers and may be set with either as an internal parameter vector, or may be read from a parameter column (as shown in the linked example). These parameters are available as variables p1, p2, ... in the function string. Here is a small example:
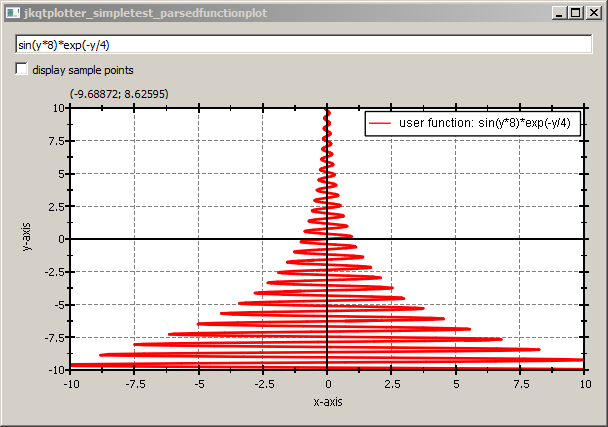
If you use the graph class JKQTPYParsedFunctionLineGraph instead of JKQTPXParsedFunctionLineGraph, you can plot functions x=f(y) (instead of y=f(x)). The function from the example above will then ahve to be changed to sin(y*8)*exp(-y/4) and the result will look like this:
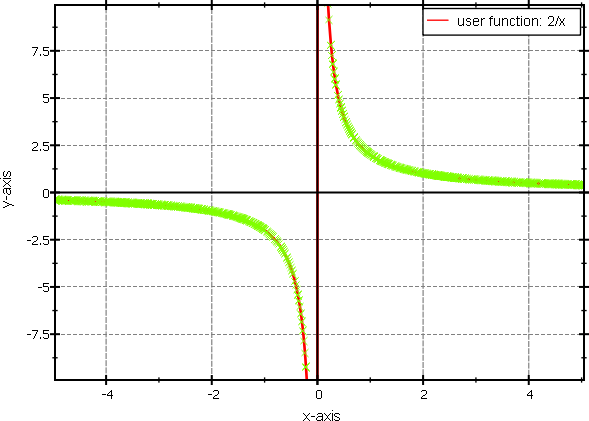
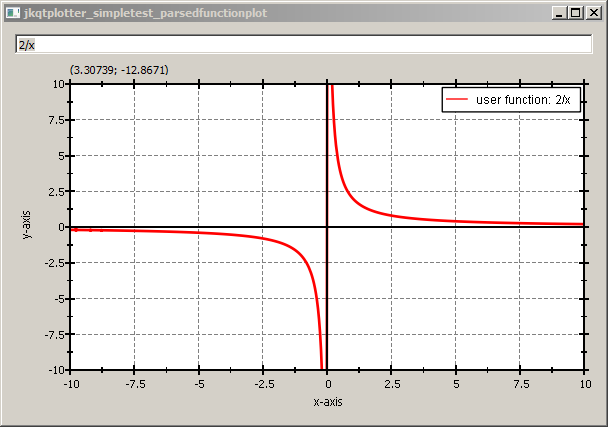
The adaptive capabilities of the rendering algorithm can be seen, when plotting e.g. 2/x, which is drawn smoothely, even around the undefined value at x=0:
With an additional checkbox in this example, you can switch drawing the actual sample points of the drawing algorithm on and off, by calling parsedFunc->setDisplaySamplePoints(...). This can be used to debug the drawing algorithm and explore its parameters (which you can set with setMinSamples(), setMaxRefinementDegree(), setSlopeTolerance(), setMinPixelPerSample()). Here is an example of a 2/x function with shown sample points: