This project (see ./examples/imageplot_userpal/) demonstrates how to use user-defined color-palettes for image plots. The source code of the main application is (see imageplot_userpal.cpp).
Build Palettes Programmatically
JKQTPlotter comes with a large set of predefined color palettes, which are enumerated in JKQTPMathImageColorPalette. In addition you can build your own palettes as simple lookup-tables of type JKQTPImageTools::LUTType (which is a QVector<QRgb>) and register them in the system (using JKQTPImageTools::registerPalette()). There are several options available for building such a palette:
- you can simply define a palette from single colors:
QColor("blue").rgb(),
QColor("green").rgb(),
QColor("white").rgb(),
QColor("yellow").rgb(),
QColor("red").rgb(),
QColor("red").rgb()
};
Such a palette will have exactly as many entries, as you specified: 
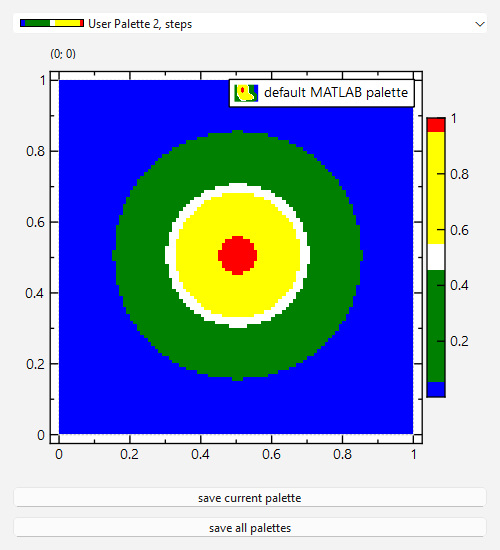
- Alternatively you can build a palette from a set of colors with assocziated positions on the values axis (typically 0..1 as these are in any way later mapped to the actual data range):
QList<QPair<double, QRgb> > palsteps2;
palsteps2<<qMakePair<double, QRgb>(0.00, QColor("blue").rgba());
palsteps2<<qMakePair<double, QRgb>(0.05, QColor("green").rgba());
palsteps2<<qMakePair<double, QRgb>(0.45, QColor("white").rgba());
palsteps2<<qMakePair<double, QRgb>(0.55, QColor("yellow").rgba());
palsteps2<<qMakePair<double, QRgb>(0.95, QColor("red").rgba());
palsteps2<<qMakePair<double, QRgb>(1.00, QColor("red").rgba());
Such a palette will have JKQTPImageTools::LUTSIZE (=255) entries and the colors are not spaced equally: 
- The palettes so far had steps, but you can also give a series of nodes with positions (on the value axis) and RGB-colors there (e.g. palsteps2 above) but then linearly interpolate between these by calling:
The resulting LUT is then: 
- Finally there is a second way of linear interpolation, where linear segments are given for the three color channels separately. To use such a definition, call JKQTPBuildColorPaletteLUTLinSegments instead (see documenttaion there).
For each of these options, you finally call JKQTPImageTools::registerPalette() to make them known to the system:
This function returns an integer, which you can cast to a JKQTPMathImageColorPalette to use your new palette:
class to plot an image from an 2-dimensional array of values stored in a column of the datastore
Definition jkqtpimage.h:771
Load Palettes from Files
In addition to building palettes/LUTs programmatically, as shown above, you can simply load palettes from files using:
This function may load different file formats (discriminated by the extension):
- XML-files (extension .xml) may contain one or more color palettes and should be formatted as follows:
<ColorMap name="PALETTENAME" space="RGB">
<Point x="scalar" r="RED" g="GREEN" b="BLUE"/>
<Point x="scalar" r="RED" g="GREEN" b="BLUE"/>
...
</ColorMap>
or with several palettes in one file:
<ColorMaps>
<ColorMap name="PALETTENAME" space="RGB">
<Point x="scalar" r="RED" g="GREEN" b="BLUE"/>
<Point x="scalar" r="RED" g="GREEN" b="BLUE"/>
...
</ColorMap>
<ColorMap name="PALETTENAME" space="RGB">
<Point x="scalar" r="RED" g="GREEN" b="BLUE"/>
<Point x="scalar" r="RED" g="GREEN" b="BLUE"/>
...
</ColorMap>
...
</ColorMaps>
- CSV-files (extensions .csv, .rgb, .pal) are simply a list of 3 or 4 comma-separated values:
red, green, blue
red, green, blue
...
or:
scalar, red, green, blue
scalar, red, green, blue
...
By default the palettes are simply read from the files as raw data. Alternatively you can linearly interpolate between the nodes in the file by calling
Examples for such palette files can be found here: /examples/imageplot_userpal/palettes/
Main Program of the Example (GUI)
The rest of the example program imageplot_userpal.cpp just generates a 2D function plot as a color-map and displays it ...
QWidget win;
QVBoxLayout* lay=new QVBoxLayout();
win.setLayout(lay);
lay->addWidget(cmbPalette);
lay->addWidget(plot);
const int NX=100;
const int NY=NX;
const double dx=0.6e-2;
const double dy=0.6e-2;
double NA=1.1;
double wavelength=488e-3;
double x=static_cast<double>(static_cast<int>(ix)-NX/2)*dx;
double y=static_cast<double>(static_cast<int>(iy)-NY/2)*dy;
const double r=sqrt(x*x+y*y);
const double v=2.0*M_PI*NA*r/wavelength;
if (ix==NX/2 && iy==NY/2) return 1.0;
else return pow(2.0*j1(v)/v, 2);
}, "imagedata");
graph->
setTitle(
"default MATLAB palette");
win.show();
win.resize(500,550);
win.setWindowTitle("JKQTPColumnMathImage, User Palettes");
void setMaintainAspectRatio(bool value)
en-/disables the maintaining of the data aspect ratio
void setMaintainAxisAspectRatio(bool value)
en-/disables the maintaining of the axis aspect ratio
virtual void setImageColumn(int __value)
column containing the displayed image
This class manages data columns (with entries of type double ), used by JKQTPlotter/JKQTBasePlotter t...
Definition jkqtpdatastorage.h:223
size_t addCalculatedImageColumn(size_t cols, size_t rows, const std::function< double(size_t, size_t)> &f, const QString &name=QString(""))
add an image column with width cols and height rows (i.e. rows * cols entries), that is calculated by...
void setHeight(double __value)
height of image
void setX(double __value)
x coordinate of lower left corner
void setWidth(double __value)
width of image
void setY(double __value)
y coordinate of lower left corner
class to plot an image from an 2-dimensional array of values
Definition jkqtpcomboboxes.h:39
void setCurrentColorPalette(JKQTPMathImageColorPalette palette)
void currentPaletteChanged(JKQTPMathImageColorPalette palette)
virtual void setTitle(const QString &title) override
sets the title of the plot (for display in key!).
plotter widget for scientific plots (uses JKQTBasePlotter to do the actual drawing)
Definition jkqtplotter.h:374
void zoomToFit(bool zoomX=true, bool zoomY=true, bool includeX0=false, bool includeY0=false, double scaleX=1.05, double scaleY=1.05)
this method zooms the graph so that all plotted datapoints are visible.
Definition jkqtplotter.h:1051
JKQTBasePlotter * getPlotter()
returns the JKQTBasePlotter object internally used for plotting
Definition jkqtplotter.h:414
size_t addGraph(JKQTPPlotElement *gr)
Definition jkqtplotter.h:796
JKQTPDatastore * getDatastore()
returns a pointer to the datastore used by this object
Definition jkqtplotter.h:621
void redrawPlot()
update the plot and the overlays
...along with a JKQTPMathImageColorPaletteComboBox to select a colormap and redraw the plot:
It also adds two QPushButtons that allow to save the current or all registered color-palettes to small PNG-Files:
QPushButton* btnSavePal=new QPushButton(QObject::tr("save current palette"), &win);
btnSavePal->connect(btnSavePal, &QPushButton::clicked, [&]() {
});
lay->addWidget(btnSavePal);
QPushButton* btnSaveAllPal=new QPushButton(QObject::tr("save all palettes"), &win);
btnSavePal->connect(btnSaveAllPal, &QPushButton::clicked, [&]() {
}
});
lay->addWidget(btnSaveAllPal);
JKQTPMathImageColorPalette currentColorPalette() const
The whole program looks like this: