JKQTPlotter trunk/v5.0.0
an extensive Qt5+Qt6 Plotter framework (including a feature-richt plotter widget, a speed-optimized, but limited variant and a LaTeX equation renderer!), written fully in C/C++ and without external dependencies
Loading...
Searching...
No Matches
Example (JKQTPlotter): Simple RGB image plot, showing a 3-channel OpenCV cv::Mat

This project (see ./examples/rgbimageplot_opencv/) simply creates a JKQTPlotter widget (as a new window) and shows an RGB image read from a BMP-file. The image is generated as an OpenCV cv::Mat image and then copied into a single column of the internal datastore (JKQTPMathImage could be directly used without the internal datastore). To copy the data a special OpenCV Interface function JKQTPCopyCvMatToColumn() is used, that copies the data from a (https://opencv.org/) cv::Mat directly into a column.

The function JKQTPCopyCvMatToColumn() is available from the (non-default) header-only extension from jkqtplotter/jkqtpinterfaceopencv.h. This header provides facilities to interface JKQTPlotter with OpenCV.The OpenCV-binding itself is header-only, and NOT compiled into the JKQtPlotter libraries. Therefore you can simply include the header and use the facilities provided by it.

The CMake-build system of JKQtPlotter (and its examples) is compatible with both OpenCV 3.4.x and 4.x and uses the standard find_package(OpenCV) facilities provided by OpenCV to compile and bind against that library. If you want to build the OpenCV-based JKQtPlotter examples (see list above), you either have to ensure that CMake finds OpenCV by itself (i.e. somewhere in the default search paths), or you can set the CMake variable OpenCV_DIR so it points to the OpenCV directory before configuring JKQtPlotter.

The source code of the main application is (see rgbimageplot_cimg.cpp:

#include <QApplication>
#include <cmath>
#include "jkqtplotter/jkqtplotter.h"
#include "jkqtplotter/graphs/jkqtpimage.h"
#include "jkqtplotter/jkqtpinterfaceopencv.h"
#include <opencv2/core.hpp>
#include <opencv2/imgcodecs.hpp>
int main(int argc, char* argv[])
{
QApplication app(argc, argv);
// 1. create a plotter window and get a pointer to the internal datastore (for convenience)
plot.getPlotter()->setUseAntiAliasingForGraphs(true); // nicer (but slower) plotting
plot.getPlotter()->setUseAntiAliasingForSystem(true); // nicer (but slower) plotting
plot.getPlotter()->setUseAntiAliasingForText(true); // nicer (but slower) text rendering
// 2. now we open a BMP-file and load it into an OpenCV cv::Mat
cv::Mat picture = cv::imread("example.bmp");
// 3. make data available to JKQTPlotter by adding it to the internal datastore.
// In this step the contents of each channel of the openCV cv::Mat is copied into a column
// of the datastore in row-major order
size_t cPictureR=JKQTPCopyCvMatToColumn(ds, picture, "R-channel", 2);
size_t cPictureG=JKQTPCopyCvMatToColumn(ds, picture, "G-channel", 1);
size_t cPictureB=JKQTPCopyCvMatToColumn(ds, picture, "B-channel", 0);
// 4. create a graph (JKQTPColumnRGBMathImage) with the columns created above as data
graph->setTitle("");
// where does the image start in the plot, given in plot-axis-coordinates (bottom-left corner)
graph->setX(0);
graph->setY(0);
// width and height of the image in plot-axis-coordinates
graph->setWidth(picture.cols);
graph->setHeight(picture.rows);
// image column with the data
// Note: this also sets the matrix sized Nx and Ny!!!
graph->setImageRColumn(cPictureR);
graph->setImageGColumn(cPictureG);
graph->setImageBColumn(cPictureB);
// determine min/max of each channel manually
graph->setImageMinR(0);
graph->setImageMaxR(255);
graph->setImageMinG(0);
graph->setImageMaxG(255);
graph->setImageMinB(0);
graph->setImageMaxB(255);
// 5. add the graphs to the plot, so it is actually displayed
plot.addGraph(graph);
// 6. set axis labels
plot.getXAxis()->setAxisLabel("x [pixels]");
plot.getYAxis()->setAxisLabel("y [pixels]");
// 7. fix axis aspect ratio to width/height, so pixels are square
plot.getPlotter()->setAspectRatio(double(picture.cols)/double(picture.rows));
// 8. autoscale the plot so the graph is contained
plot.zoomToFit();
// show plotter and make it a decent size
plot.show();
plot.resize(800,600);
plot.setWindowTitle("JKQTPColumnMathImage");
return app.exec();
}
void setAspectRatio(double __value)
sets the data aspect ratio, enforced with setMaintainApsectRatio(true)
void setMaintainAspectRatio(bool value)
en-/disables the maintaining of the data aspect ratio
void setUseAntiAliasingForSystem(bool __value)
specifies whether to use antialiasing for plotting the coordinate system
void setUseAntiAliasingForGraphs(bool __value)
specifies whether to use antialiasing for plotting the graphs
void setUseAntiAliasingForText(bool __value)
specifies whether to use antialiasing when drawing any text
like JKQTPRGBMathImage but reads images from columns of the datastore
Definition jkqtpimagergb.h:490
virtual void setImageBColumn(int __value)
image column for B channel
virtual void setImageRColumn(int __value)
image column for R channel
virtual void setImageGColumn(int __value)
image column for G channel
void setAxisLabel(const QString &__value)
axis label of the axis
This class manages data columns (with entries of type double ), used by JKQTPlotter/JKQTBasePlotter t...
Definition jkqtpdatastorage.h:282
void setHeight(double __value)
height of image
void setX(double __value)
x coordinate of lower left corner
void setWidth(double __value)
width of image
void setY(double __value)
y coordinate of lower left corner
void setImageMaxR(double m)
red image value range maximum
void setImageMaxG(double __value)
green image value range maximum
virtual void setTitle(const QString &title) override
sets the title of the plot (for display in key!).
void setImageMinB(double __value)
blue image value range minimum
void setImageMinR(double m)
red image value range minimum
void setImageMinG(double __value)
green image value range minimum
void setImageMaxB(double __value)
blue image value range maximum
plotter widget for scientific plots (uses JKQTBasePlotter to do the actual drawing)
Definition jkqtplotter.h:364
void zoomToFit(bool zoomX=true, bool zoomY=true, bool includeX0=false, bool includeY0=false, double scaleX=1.05, double scaleY=1.05)
this method zooms the graph so that all plotted datapoints are visible.
Definition jkqtplotter.h:1039
JKQTPVerticalAxisBase * getYAxis(JKQTPCoordinateAxisRef axis=JKQTPPrimaryAxis)
returns the y-axis objet of the plot
Definition jkqtplotter.h:713
JKQTBasePlotter * getPlotter()
returns the JKQTBasePlotter object internally used for plotting
Definition jkqtplotter.h:404
void addGraph(JKQTPPlotElement *gr)
Definition jkqtplotter.h:784
JKQTPDatastore * getDatastore()
returns a pointer to the datastore used by this object
Definition jkqtplotter.h:611
JKQTPHorizontalAxisBase * getXAxis(JKQTPCoordinateAxisRef axis=JKQTPPrimaryAxis)
returns the x-axis objet of the plot
Definition jkqtplotter.h:711
size_t JKQTPCopyCvMatToColumn(JKQTPDatastore *datastore, const cv::Mat &mat, const QString &name=QString(""), int channel=0)
add one external column to the datastore. It will be filled with the contents of CImg matrix cv::Mat
Definition jkqtpinterfaceopencv.h:65

The result looks like this:

imageplot

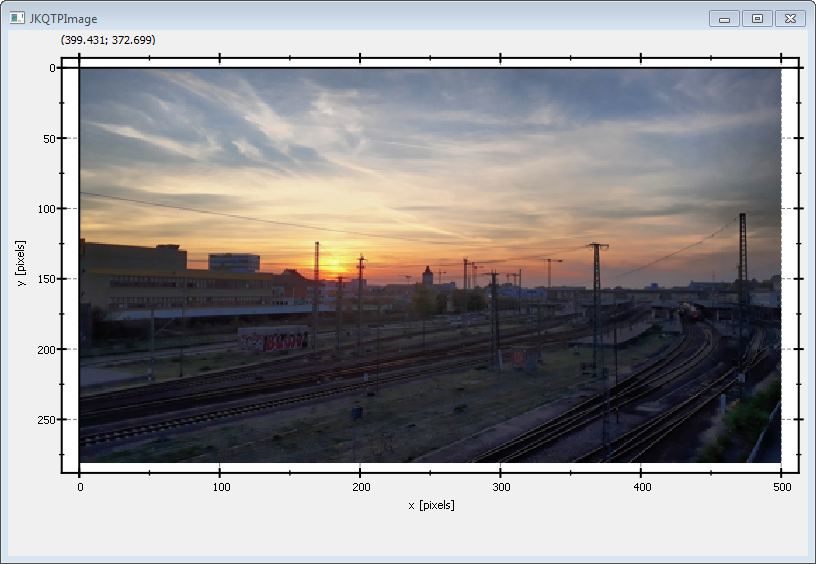
The image is upside-down, because computer images use a coordinate system with 0 at the top-left (left-handed coordinate system) and the JKQTPlotter has its 0 at the bottom-left (right-handed coordinate system).

You can modify the program above to display the image in the correct orientation, by adding the line

// 5.1 invert y-axis, so image is oriented correctly
plot.getYAxis()->setInverted(true);
void setInverted(bool __value)
indicates whether the axis is to be inverted or not

This will reorient the y-axis to point from top to bottom (for increasing positive coordinates):

imageplot

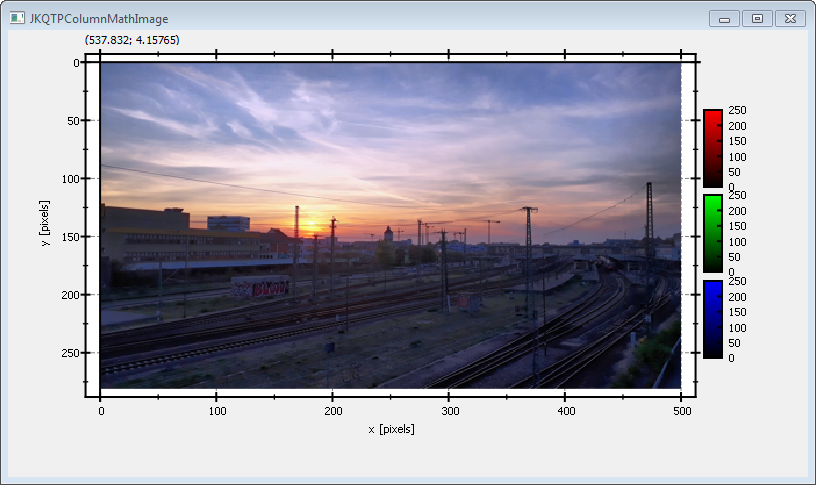
See examples/rgbimageplot for a detailed description of the other possibilities that the class JKQTPColumnRGBMathImage offer with respect to determining how an image is plotted.