JKQTPlotter trunk/v5.0.0
an extensive Qt5+Qt6 Plotter framework (including a feature-richt plotter widget, a speed-optimized, but limited variant and a LaTeX equation renderer!), written fully in C/C++ and without external dependencies
Loading...
Searching...
No Matches
Example (JKQTPlotter): Simple math image plot, showin a 1-channel OpenCV cv::Mat

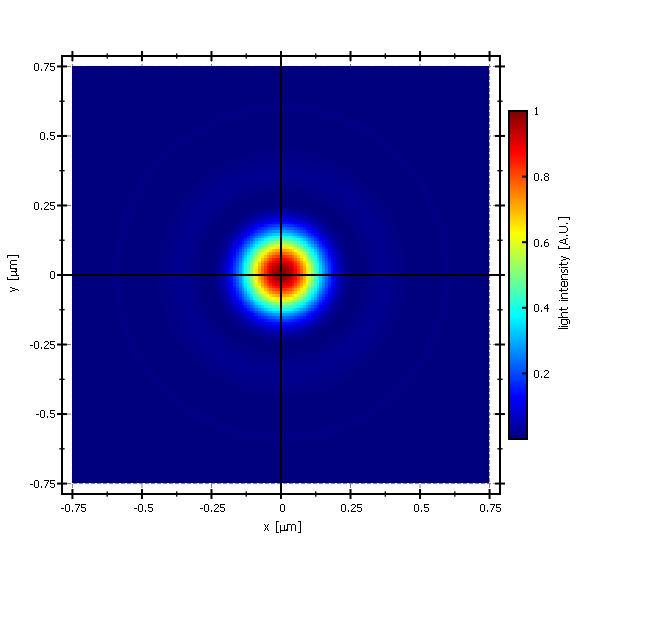
This project (see ./examples/imageplot_opencv/) simply creates a JKQTPlotter widget (as a new window) and adds a color-coded image plot of a mathematical function (here the Airy disk). The image is generated as an OpenCV cv::Mat (see https://opencv.org/) image and then copied into a single column of the internal datastore (JKQTPMathImage could be directly used without the internal datastore). To copy the data a special OpenCV Interface function JKQTPCopyCvMatToColumn() is used, that copies the data from a cv::Mat directly into a column.

The function JKQTPCopyCvMatToColumn() is available from the (non-default) header-only extension from jkqtplotter/jkqtpinterfaceopencv.h. This header provides facilities to interface JKQTPlotter with OpenCV. The OpenCV-binding itself is header-only, and NOT compiled into the JKQtPlotter libraries. Therefore you can simply include the header and use the facilities provided by it.

The CMake-build system of JKQtPlotter (and its examples) is compatible with both OpenCV 3.4.x and 4.x and uses the standard find_package(OpenCV) facilities provided by OpenCV to compile and bind against that library. If you want to build the OpenCV-based JKQtPlotter examples (see list above), you either have to ensure that CMake finds OpenCV by itself (i.e. somewhere in the default search paths), or you can set the CMake variable OpenCV_DIR so it points to the OpenCV directory before configuring JKQtPlotter.

The source code of the main application is (see imageplot_opencv.cpp:

#include <QApplication>
#include <cmath>
#include "jkqtplotter/jkqtplotter.h"
#include "jkqtplotter/graphs/jkqtpimage.h"
#include "jkqtplotter/jkqtpinterfaceopencv.h"
#include <opencv/cv.h>
#ifndef M_PI
#define M_PI 3.14159265358979323846
#endif
int main(int argc, char* argv[])
{
QApplication app(argc, argv);
// 1. create a plotter window and get a pointer to the internal datastore (for convenience)
plot.getPlotter()->setUseAntiAliasingForGraphs(true); // nicer (but slower) plotting
plot.getPlotter()->setUseAntiAliasingForSystem(true); // nicer (but slower) plotting
plot.getPlotter()->setUseAntiAliasingForText(true); // nicer (but slower) text rendering
// 2. now we create data for the charts (taken from https://commons.wikimedia.org/wiki/File:Energiemix_Deutschland.svg)
cv::Mat airydisk(150, 150, CV_64FC1); // OpenCV-Image for the data
const double dx=1e-2; // size of a pixel in x-direction [micrometers]
const double dy=1e-2; // size of a pixel in x-direction [micrometers]
const double w=static_cast<double>(airydisk.cols)*dx;
const double h=static_cast<double>(airydisk.rows)*dy;
// 2.1 Parameters for airy disk plot (see https://en.wikipedia.org/wiki/Airy_disk)
double NA=1.1; // numerical aperture of lens
double wavelength=488e-3; // wavelength of the light [micrometers]
// 2.2 calculate image of airy disk in a row-major array
double x, y=-h/2.0;
for (int iy=0; iy<airydisk.rows; iy++ ) {
x=-w/2.0;
for (int ix=0; ix<airydisk.cols; ix++ ) {
const double r=sqrt(x*x+y*y);
const double v=2.0*M_PI*NA*r/wavelength;
airydisk.at<double>(iy,ix) = pow(2.0*j1(v)/v, 2);
x+=dx;
}
y+=dy;
}
// 3. make data available to JKQTPlotter by adding it to the internal datastore.
// In this step the contents of one channel of the openCV cv::Mat is copied into a column
// of the datastore in row-major order
size_t cAiryDisk=JKQTPCopyCvMatToColumn(ds, airydisk, "imagedata");
// 4. create a graph (JKQTPColumnMathImage) with the column created above as data
// The data is color-coded with the color-palette JKQTPMathImageMATLAB
// the converted range of data is determined automatically because setAutoImageRange(true)
graph->setTitle("");
// image column with the data
graph->setImageColumn(cAiryDisk);
// set size of the data (the datastore does not contain this info, as it only manages 1D columns of data and this is used to assume a row-major ordering
graph->setNx(airydisk.cols);
graph->setNy(airydisk.rows);
// where does the image start in the plot, given in plot-axis-coordinates (bottom-left corner)
graph->setX(-w/2.0);
graph->setY(-h/2.0);
// width and height of the image in plot-axis-coordinates
graph->setWidth(w);
graph->setHeight(h);
// color-map is "MATLAB"
// get coordinate axis of color-bar and set its label
graph->getColorBarRightAxis()->setAxisLabel("light intensity [A.U.]");
// determine min/max of data automatically and use it to set the range of the color-scale
graph->setAutoImageRange(true);
// you can set the color-scale range manually by using:
// graph->setAutoImageRange(false);
// graph->setImageMin(0);
// graph->setImageMax(10);
// 5. add the graphs to the plot, so it is actually displayed
plot.addGraph(graph);
// 6. set axis labels
plot.getXAxis()->setAxisLabel("x [{\\mu}m]");
plot.getYAxis()->setAxisLabel("y [{\\mu}m]");
// 7. fix axis and plot aspect ratio to 1
// 8 autoscale the plot so the graph is contained
plot.zoomToFit();
// show plotter and make it a decent size
plot.show();
plot.resize(600,600);
plot.setWindowTitle("JKQTPColumnMathImage");
return app.exec();
}
void setMaintainAspectRatio(bool value)
en-/disables the maintaining of the data aspect ratio
void setUseAntiAliasingForSystem(bool __value)
specifies whether to use antialiasing for plotting the coordinate system
void setMaintainAxisAspectRatio(bool value)
en-/disables the maintaining of the axis aspect ratio
void setUseAntiAliasingForGraphs(bool __value)
specifies whether to use antialiasing for plotting the graphs
void setUseAntiAliasingForText(bool __value)
specifies whether to use antialiasing when drawing any text
JKQTPVerticalIndependentAxis * getColorBarRightAxis()
object used for color bar axes at the right
void setColorPalette(int pal)
palette for plotting an image
void setAutoImageRange(bool __value)
indicates whether to estimate min/max of the image automatically
class to plot an image from an 2-dimensional array of values stored in a column of the datastore
Definition jkqtpimage.h:771
virtual void setImageColumn(int __value)
column containing the displayed image
void setAxisLabel(const QString &__value)
axis label of the axis
This class manages data columns (with entries of type double ), used by JKQTPlotter/JKQTBasePlotter t...
Definition jkqtpdatastorage.h:282
void setHeight(double __value)
height of image
void setX(double __value)
x coordinate of lower left corner
void setWidth(double __value)
width of image
void setY(double __value)
y coordinate of lower left corner
void setNy(int __value)
height of the data array data in pt
void setNx(int __value)
width of the data array data in pt
virtual void setTitle(const QString &title) override
sets the title of the plot (for display in key!).
plotter widget for scientific plots (uses JKQTBasePlotter to do the actual drawing)
Definition jkqtplotter.h:364
void zoomToFit(bool zoomX=true, bool zoomY=true, bool includeX0=false, bool includeY0=false, double scaleX=1.05, double scaleY=1.05)
this method zooms the graph so that all plotted datapoints are visible.
Definition jkqtplotter.h:1039
JKQTPVerticalAxisBase * getYAxis(JKQTPCoordinateAxisRef axis=JKQTPPrimaryAxis)
returns the y-axis objet of the plot
Definition jkqtplotter.h:713
JKQTBasePlotter * getPlotter()
returns the JKQTBasePlotter object internally used for plotting
Definition jkqtplotter.h:404
void addGraph(JKQTPPlotElement *gr)
Definition jkqtplotter.h:784
JKQTPDatastore * getDatastore()
returns a pointer to the datastore used by this object
Definition jkqtplotter.h:611
JKQTPHorizontalAxisBase * getXAxis(JKQTPCoordinateAxisRef axis=JKQTPPrimaryAxis)
returns the x-axis objet of the plot
Definition jkqtplotter.h:711
size_t JKQTPCopyCvMatToColumn(JKQTPDatastore *datastore, const cv::Mat &mat, const QString &name=QString(""), int channel=0)
add one external column to the datastore. It will be filled with the contents of CImg matrix cv::Mat
Definition jkqtpinterfaceopencv.h:65
@ JKQTPMathImageMATLAB
Definition jkqtpbasicimagetools.h:101

The result looks like this:

imageplot

See examples/imageplot for a detailed description of the other possibilities that the class JKQTPColumnMathImage (and also JKQTPMathImage) offer with respect to determining how an image is plottet.