JKQTPlotter trunk/v5.0.0
an extensive Qt5+Qt6 Plotter framework (including a feature-richt plotter widget, a speed-optimized, but limited variant and a LaTeX equation renderer!), written fully in C/C++ and without external dependencies
Loading...
Searching...
No Matches
Example (JKQTPlotter): Simple math image plot without use of central JKQTdatastore

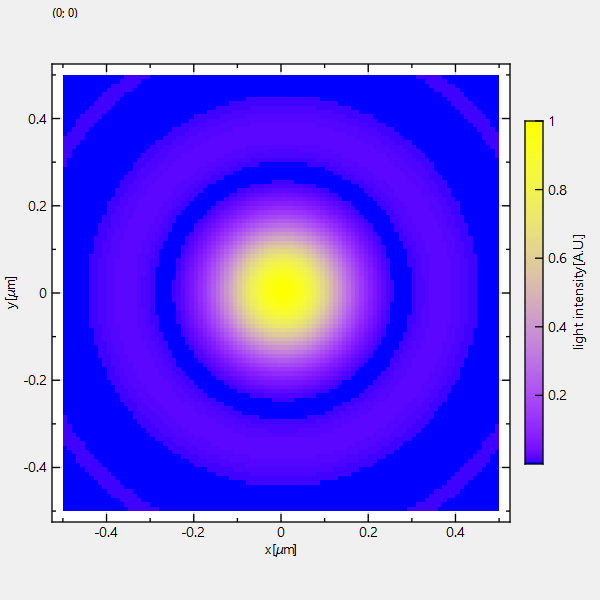
This project (see ./examples/imageplot_nodatastore/) simply creates a JKQTPlotter widget (as a new window) and adds a color-coded image plot of a mathematical function (here the Airy disk). The image is stored as a simple C-array in row-major ordering and then given to a JKQTPMathImage to visualize it. The data is stored as a pointer directly in the JKQTPMathImage object. There is also a variant JKQTPColumnMathImage of JKQTPMathImage, which references a column in the internal JKQTdatastore and uses the data there for plotting. In both cases data has to be organized as a row-major matrix of values. JKQTPMathImage supports different dataytpes ([u]nit8/16/32/64,float,double see JKQTPMathImageBase::DataType) that can be configured e.g. by setData().

The source code of the main application is (see imageplot_nodatastore.cpp:

#include <QApplication>
#include <cmath>
#include "jkqtplotter/jkqtplotter.h"
#include "jkqtplotter/graphs/jkqtpimage.h"
#ifndef M_PI
#define M_PI 3.14159265358979323846
#endif
int main(int argc, char* argv[])
{
QApplication app(argc, argv);
// 1. create a plotter window and get a pointer to the internal datastore (for convenience)
plot.getPlotter()->setUseAntiAliasingForGraphs(true); // nicer (but slower) plotting
plot.getPlotter()->setUseAntiAliasingForSystem(true); // nicer (but slower) plotting
plot.getPlotter()->setUseAntiAliasingForText(true); // nicer (but slower) text rendering
// 2. now we create data for the charts (taken from https://commons.wikimedia.org/wiki/File:Energiemix_Deutschland.svg)
const int NX=100; // image dimension in x-direction [pixels]
const int NY=100; // image dimension in x-direction [pixels]
const double dx=1e-2; // size of a pixel in x-direction [micrometers]
const double dy=1e-2; // size of a pixel in x-direction [micrometers]
const double w=static_cast<double>(NX)*dx;
const double h=static_cast<double>(NY)*dy;
double airydisk[NX*NY]; // row-major image
// 2.1 Parameters for airy disk plot (see https://en.wikipedia.org/wiki/Airy_disk)
double NA=1.1; // numerical aperture of lens
double wavelength=488e-3; // wavelength of the light [micrometers]
// 2.2 calculate image of airy disk in a row-major array
double x, y=-h/2.0;
for (int iy=0; iy<NY; iy++ ) {
x=-w/2.0;
for (int ix=0; ix<NX; ix++ ) {
const double r=sqrt(x*x+y*y);
const double v=2.0*M_PI*NA*r/wavelength;
airydisk[iy*NX+ix] = pow(2.0*j1(v)/v, 2);
x+=dx;
}
y+=dy;
}
// 3. create a graph (JKQTPMathImage) with referencing the data created above as data
// The data is color-coded with the color-palette JKQTPMathImageBLUEYELLOW
// the converted range of data is determined automatically because setAutoImageRange(true)
JKQTPMathImage* graph=new JKQTPMathImage(&plot);
graph->setTitle("");
// set array as datasource, with correct size NX*NY and datatype JKQTPMathImageBase::DataType::DoubleArray
graph->setData(airydisk, NX, NY, JKQTPMathImageBase::DataType::DoubleArray);
// where does the image start in the plot, given in plot-axis-coordinates (bottom-left corner)
graph->setX(-w/2.0);
graph->setY(-h/2.0);
// width and height of the image in plot-axis-coordinates
graph->setWidth(w);
graph->setHeight(h);
// color-map is "BLUEYELLOW"
// get coordinate axis of color-bar and set its label
graph->getColorBarRightAxis()->setAxisLabel("light intensity [A.U.]");
// determine min/max of data automatically and use it to set the range of the color-scale
graph->setAutoImageRange(true);
// you can set the color-scale range manually by using:
// graph->setAutoImageRange(false);
// graph->setImageMin(0);
// graph->setImageMax(10);
// 4. add the graphs to the plot, so it is actually displayed
plot.addGraph(graph);
// 5. set axis labels
plot.getXAxis()->setAxisLabel("x [{\\mu}m]");
plot.getYAxis()->setAxisLabel("y [{\\mu}m]");
// 6. fix axis and plot aspect ratio to 1
// 7. autoscale the plot so the graph is contained
plot.zoomToFit();
// show plotter and make it a decent size
plot.show();
plot.resize(600,600);
plot.setWindowTitle("JKQTPMathImage");
return app.exec();
}
void setMaintainAspectRatio(bool value)
en-/disables the maintaining of the data aspect ratio
void setUseAntiAliasingForSystem(bool __value)
specifies whether to use antialiasing for plotting the coordinate system
void setMaintainAxisAspectRatio(bool value)
en-/disables the maintaining of the axis aspect ratio
void setUseAntiAliasingForGraphs(bool __value)
specifies whether to use antialiasing for plotting the graphs
void setUseAntiAliasingForText(bool __value)
specifies whether to use antialiasing when drawing any text
JKQTPVerticalIndependentAxis * getColorBarRightAxis()
object used for color bar axes at the right
void setColorPalette(int pal)
palette for plotting an image
void setAutoImageRange(bool __value)
indicates whether to estimate min/max of the image automatically
void setAxisLabel(const QString &__value)
axis label of the axis
void setHeight(double __value)
height of image
void setX(double __value)
x coordinate of lower left corner
void setWidth(double __value)
width of image
void setY(double __value)
y coordinate of lower left corner
virtual void setData(const void *__value)
points to the data array, holding the image
class to plot an image from an 2-dimensional array of values
Definition jkqtpimage.h:433
virtual void setTitle(const QString &title) override
sets the title of the plot (for display in key!).
plotter widget for scientific plots (uses JKQTBasePlotter to do the actual drawing)
Definition jkqtplotter.h:364
void zoomToFit(bool zoomX=true, bool zoomY=true, bool includeX0=false, bool includeY0=false, double scaleX=1.05, double scaleY=1.05)
this method zooms the graph so that all plotted datapoints are visible.
Definition jkqtplotter.h:1039
JKQTPVerticalAxisBase * getYAxis(JKQTPCoordinateAxisRef axis=JKQTPPrimaryAxis)
returns the y-axis objet of the plot
Definition jkqtplotter.h:713
JKQTBasePlotter * getPlotter()
returns the JKQTBasePlotter object internally used for plotting
Definition jkqtplotter.h:404
void addGraph(JKQTPPlotElement *gr)
Definition jkqtplotter.h:784
JKQTPHorizontalAxisBase * getXAxis(JKQTPCoordinateAxisRef axis=JKQTPPrimaryAxis)
returns the x-axis objet of the plot
Definition jkqtplotter.h:711
@ JKQTPMathImageBLUEYELLOW
Definition jkqtpbasicimagetools.h:234

The result looks like this:

imageplot_nodatastore

See examples/imageplot for a detailed description of the other possibilities that the class JKQTPColumnMathImage (and also JKQTPMathImage) offer with respect to determining how an image is plottet.