JKQTPlotter trunk/v5.0.0
an extensive Qt5+Qt6 Plotter framework (including a feature-richt plotter widget, a speed-optimized, but limited variant and a LaTeX equation renderer!), written fully in C/C++ and without external dependencies
Loading...
Searching...
No Matches
Example (JKQTPlotter): Simple math image plot with modifier datat

This project (see ./examples/imageplot_modifier/) creates a JKQTPlotter widget (as a new window) and adds a color-coded image plot of a mathematical function (here sin(r)). Then a second image (linearly scaling from 1 in the center to 0 at the borders) is used to modify the first image. The modification can alter several properties of the original image, like its saturation, its transparency (alpha) ...

The source code of the main application is (see imageplot_modifier.cpp:

#include <QApplication>
#include <cmath>
#include "jkqtplotter/jkqtplotter.h"
#include "jkqtplotter/graphs/jkqtpimage.h"
#ifndef M_PI
#define M_PI 3.14159265358979323846
#endif
int main(int argc, char* argv[])
{
QApplication app(argc, argv);
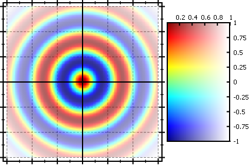
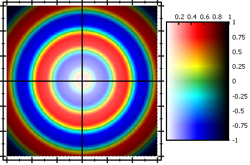
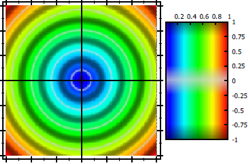
// 1. create a plotter window and get a pointer to the internal datastore (for convenience)
plot.getPlotter()->setUseAntiAliasingForGraphs(true); // nicer (but slower) plotting
plot.getPlotter()->setUseAntiAliasingForSystem(true); // nicer (but slower) plotting
plot.getPlotter()->setUseAntiAliasingForText(true); // nicer (but slower) text rendering
// 2. now we create data for the charts (taken from https://commons.wikimedia.org/wiki/File:Energiemix_Deutschland.svg)
const int NX=150; // image dimension in x-direction [pixels]
const int NY=150; // image dimension in x-direction [pixels]
double image[NX*NY]; // row-major image
double modifier[NX*NY]; // row-major modfier image
// 2 calculate image of airy disk in a row-major array
double x, y=-static_cast<double>(NY)/2.0;
for (int iy=0; iy<NY; iy++ ) {
x=-static_cast<double>(NX)/2.0;
for (int ix=0; ix<NX; ix++ ) {
const double r=sqrt(x*x+y*y);
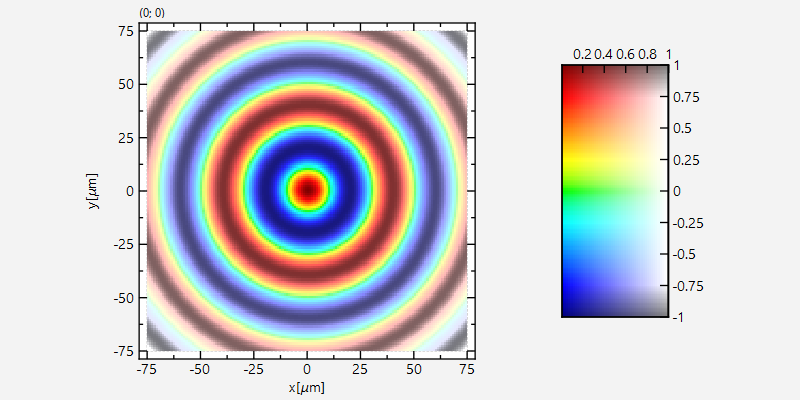
image[iy*NX+ix] = cos(M_PI*r/20.0);
modifier[iy*NX+ix] = 1.0-r/sqrt(NX*NX/4.0+NY*NY/4.0);
x+=1;
}
y+=1;
}
// 3. make data available to JKQTPlotter by adding it to the internal datastore.
// In this step the contents of C-array airydisk is copied into a column
// of the datastore in row-major order
size_t cImage=ds->addCopiedImageAsColumn(image, NX, NY, "imagedata");
size_t cModifier=ds->addCopiedImageAsColumn(modifier, NX, NY, "modifier");
// 4. create a graph (JKQTPColumnMathImage) with the column created above as data
// The data is color-coded with the color-palette JKQTPMathImageMATLAB
// the converted range of data is determined automatically because setAutoImageRange(true)
graph->setTitle("");
// image column with the data
graph->setImageColumn(cImage);
// now set the modifier image:
graph->setModifierColumn(cModifier);
graph->setAutoModifierRange(true);
// ... and specify which image property is modified (here the saturation, but ModifyAlpha for the transparency and ModifyValue from the HSV color-model are also possible):
graph->setModifierMode(JKQTPMathImageBase::ModifySaturation);
// set size of the data (the datastore does not contain this info, as it only manages 1D columns of data and this is used to assume a row-major ordering
graph->setNx(NX);
graph->setNy(NY);
// where does the image start in the plot, given in plot-axis-coordinates (bottom-left corner)
graph->setX(-NX/2.0);
graph->setY(-NX/2.0);
// width and height of the image in plot-axis-coordinates
graph->setWidth(NX);
graph->setHeight(NY);
// color-map is "MATLAB"
// determine min/max of data automatically and use it to set the range of the color-scale
graph->setAutoImageRange(true);
// 5. add the graphs to the plot, so it is actually displayed
plot.addGraph(graph);
// 6. set axis labels
plot.getXAxis()->setAxisLabel("x [{\\mu}m]");
plot.getYAxis()->setAxisLabel("y [{\\mu}m]");
// 7. fix axis and plot aspect ratio to 1
// 8 autoscale the plot so the graph is contained
plot.zoomToFit();
// show plotter and make it a decent size
plot.show();
plot.resize(500,500);
plot.setWindowTitle("JKQTPColumnMathImage");
return app.exec();
}
void setMaintainAspectRatio(bool value)
en-/disables the maintaining of the data aspect ratio
void setUseAntiAliasingForSystem(bool __value)
specifies whether to use antialiasing for plotting the coordinate system
void setMaintainAxisAspectRatio(bool value)
en-/disables the maintaining of the axis aspect ratio
void setUseAntiAliasingForGraphs(bool __value)
specifies whether to use antialiasing for plotting the graphs
void setUseAntiAliasingForText(bool __value)
specifies whether to use antialiasing when drawing any text
void setColorPalette(int pal)
palette for plotting an image
void setAutoImageRange(bool __value)
indicates whether to estimate min/max of the image automatically
void setModifierMode(const JKQTPMathImageModifierMode &__value)
how to apply the modifier column dataModifier
void setAutoModifierRange(bool __value)
indicates whether to estimate min/max of the modifier automatically
class to plot an image from an 2-dimensional array of values stored in a column of the datastore
Definition jkqtpimage.h:771
virtual void setImageColumn(int __value)
column containing the displayed image
virtual void setModifierColumn(int __value)
column containing the modifier image
void setAxisLabel(const QString &__value)
axis label of the axis
This class manages data columns (with entries of type double ), used by JKQTPlotter/JKQTBasePlotter t...
Definition jkqtpdatastorage.h:282
size_t addCopiedImageAsColumn(const T *data, size_t width, size_t height, const QString &name=QString(""), size_t stride=1, size_t start=0)
add one external column to the datastore. It contains width * height rows. The external data is assum...
Definition jkqtpdatastorage.h:2831
void setHeight(double __value)
height of image
void setX(double __value)
x coordinate of lower left corner
void setWidth(double __value)
width of image
void setY(double __value)
y coordinate of lower left corner
void setNy(int __value)
height of the data array data in pt
void setNx(int __value)
width of the data array data in pt
virtual void setTitle(const QString &title) override
sets the title of the plot (for display in key!).
plotter widget for scientific plots (uses JKQTBasePlotter to do the actual drawing)
Definition jkqtplotter.h:364
void zoomToFit(bool zoomX=true, bool zoomY=true, bool includeX0=false, bool includeY0=false, double scaleX=1.05, double scaleY=1.05)
this method zooms the graph so that all plotted datapoints are visible.
Definition jkqtplotter.h:1039
JKQTPVerticalAxisBase * getYAxis(JKQTPCoordinateAxisRef axis=JKQTPPrimaryAxis)
returns the y-axis objet of the plot
Definition jkqtplotter.h:713
JKQTBasePlotter * getPlotter()
returns the JKQTBasePlotter object internally used for plotting
Definition jkqtplotter.h:404
void addGraph(JKQTPPlotElement *gr)
Definition jkqtplotter.h:784
JKQTPDatastore * getDatastore()
returns a pointer to the datastore used by this object
Definition jkqtplotter.h:611
JKQTPHorizontalAxisBase * getXAxis(JKQTPCoordinateAxisRef axis=JKQTPPrimaryAxis)
returns the x-axis objet of the plot
Definition jkqtplotter.h:711
@ JKQTPMathImageMATLAB
Definition jkqtpbasicimagetools.h:101

The data image (sin(r/30)) on its own looks like this:
imageplot_modifier_imageonly
and the modifier image on its own would look like this:
imageplot_modifier_modifieronly

Combined the two form this plot:
imageplot_modifier

There are several modification modes available (see also documentation of JKQTPMathImageBase::ModifierMode):

  • no modification JKQTPMathImageBase::ModifierMode::ModifyNone:
  • modify the VALUE-channel from the HSV color space JKQTPMathImageBase::ModifierMode::ModifyValue:
  • modify the SATURATION-channel from the HSV color space JKQTPMathImageBase::ModifierMode::ModifySaturation:
  • modify the ALPHA/TRANSPARENCY-channel from the RGBA color space JKQTPMathImageBase::ModifierMode::ModifyAlpha:
  • modify the LUMINANCE-channel from the HSL color space JKQTPMathImageBase::ModifierMode::ModifyLuminance:
  • modify the HUE-channel from the HSV color space JKQTPMathImageBase::ModifierMode::ModifyHue:

See examples/imageplot for a detailed description of the other possibilities that the class JKQTPColumnMathImage (and also JKQTPMathImage) offer with respect to determining how an image is plotted. You can combine all options there with the modifier feature described here.