JKQTPlotter trunk/v5.0.0
an extensive Qt5+Qt6 Plotter framework (including a feature-richt plotter widget, a speed-optimized, but limited variant and a LaTeX equation renderer!), written fully in C/C++ and without external dependencies
Loading...
Searching...
No Matches
Example (JKQTPlotter): Simple math image plot, showin a 1-channel CImg image

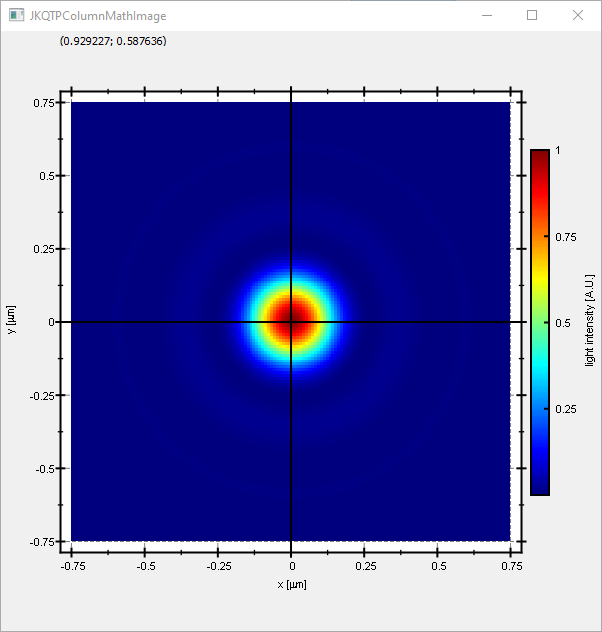
This project (see ./examples/imageplot_cimg/) simply creates a JKQTPlotter widget (as a new window) and adds a color-coded image plot of a mathematical function (here the Airy disk). The image is generated as a CImg cimg_library::CImg<double> image and then copied into a single column of the internal datastore (JKQTPMathImage could be directly used without the internal datastore).

To copy the data a special CImg Interface function JKQTPCopyCImgToColumn() is used, that copies the data from a cimg_library::CImg<double> directly into a column.

The function JKQTPCopyCImgToColumn() is available from the (non-default) header-only extension from jkqtplotter/jkqtpinterfacecimg.h. This header provides facilities to interface JKQTPlotter with CImg. The CImg-binding itself is header-only, and NOT compiled into the JKQtPlotter libraries. Therefore you can simply include the header and use the facilities provided by it.

The CMake-build system of JKQtPlotter (and its examples) provides facilities to allow for find_package(CImg) to compile against that library. If you want to build the CImg-based JKQtPlotter examples (see list above), you either have to ensure that CMake finds CImg by itself (i.e. somewhere in the default search paths, e.g. CMAKE_INSTALL_PREFIX), or you can set the CMake variable CImg_DIR so it points to the directory of the CImg.h file, or before configuring JKQtPlotter.

The source code of the main application is (see imageplot_cimg.cpp:

#include <QApplication>
#include <cmath>
#include "jkqtplotter/jkqtplotter.h"
#include "jkqtplotter/graphs/jkqtpscatter.h"
#include "jkqtplotter/graphs/jkqtpimage.h"
#include "jkqtplotter/jkqtpinterfacecimg.h"
#include "CImg.h"
#ifndef M_PI
#define M_PI 3.14159265358979323846
#endif
int main(int argc, char* argv[])
{
QApplication app(argc, argv);
// 1. create a plotter window and get a pointer to the internal datastore (for convenience)
plot.getPlotter()->setUseAntiAliasingForGraphs(true); // nicer (but slower) plotting
plot.getPlotter()->setUseAntiAliasingForSystem(true); // nicer (but slower) plotting
plot.getPlotter()->setUseAntiAliasingForText(true); // nicer (but slower) text rendering
// 2. now we create data for the charts (taken from https://commons.wikimedia.org/wiki/File:Energiemix_Deutschland.svg)
cimg_library::CImg<double> airydisk(150, 150); // CImg<T>-Image for the data
const double dx=1e-2; // size of a pixel in x-direction [micrometers]
const double dy=1e-2; // size of a pixel in x-direction [micrometers]
const double w=static_cast<double>(airydisk.width())*dx;
const double h=static_cast<double>(airydisk.height())*dy;
// 2.1 Parameters for airy disk plot (see https://en.wikipedia.org/wiki/Airy_disk)
double NA=1.1; // numerical aperture of lens
double wavelength=488e-3; // wavelength of the light [micrometers]
// 2.2 calculate image of airy disk in a row-major array
double x, y=-h/2.0;
for (int iy=0; iy<airydisk.height(); iy++ ) {
x=-w/2.0;
for (int ix=0; ix<airydisk.width(); ix++ ) {
const double r=sqrt(x*x+y*y);
const double v=2.0*M_PI*NA*r/wavelength;
airydisk(iy,ix) = pow(2.0*j1(v)/v, 2);
x+=dx;
}
y+=dy;
}
// 3. make data available to JKQTPlotter by adding it to the internal datastore.
// In this step the contents of one channel of the CImg cimg_library::CImg<double> is copied into a column
// of the datastore in row-major order
size_t cAiryDisk=JKQTPCopyCImgToColumn(ds, airydisk, "imagedata");
// 4. create a graph (JKQTPColumnMathImage) with the column created above as data
// The data is color-coded with the color-palette JKQTPMathImageMATLAB
// the converted range of data is determined automatically because setAutoImageRange(true)
graph->setTitle("");
// image column with the data
graph->setImageColumn(cAiryDisk);
// set size of the data (the datastore does not contain this info, as it only manages 1D columns of data and this is used to assume a row-major ordering
// where does the image start in the plot, given in plot-axis-coordinates (bottom-left corner)
graph->setX(-w/2.0);
graph->setY(-h/2.0);
// width and height of the image in plot-axis-coordinates
graph->setWidth(w);
graph->setHeight(h);
// color-map is "MATLAB"
// get coordinate axis of color-bar and set its label
graph->getColorBarRightAxis()->setAxisLabel("light intensity [A.U.]");
// determine min/max of data automatically and use it to set the range of the color-scale
graph->setAutoImageRange(true);
// you can set the color-scale range manually by using:
// graph->setAutoImageRange(false);
// graph->setImageMin(0);
// graph->setImageMax(10);
// 5. add the graphs to the plot, so it is actually displayed
plot.addGraph(graph);
// 6. set axis labels
plot.getXAxis()->setAxisLabel("x [{\\mu}m]");
plot.getYAxis()->setAxisLabel("y [{\\mu}m]");
// 7. fix axis and plot aspect ratio to 1
// 8 autoscale the plot so the graph is contained
plot.zoomToFit();
// show plotter and make it a decent size
plot.show();
plot.resize(600,600);
plot.setWindowTitle("JKQTPColumnMathImage");
return app.exec();
}
void setMaintainAspectRatio(bool value)
en-/disables the maintaining of the data aspect ratio
void setUseAntiAliasingForSystem(bool __value)
specifies whether to use antialiasing for plotting the coordinate system
void setMaintainAxisAspectRatio(bool value)
en-/disables the maintaining of the axis aspect ratio
void setUseAntiAliasingForGraphs(bool __value)
specifies whether to use antialiasing for plotting the graphs
void setUseAntiAliasingForText(bool __value)
specifies whether to use antialiasing when drawing any text
JKQTPVerticalIndependentAxis * getColorBarRightAxis()
object used for color bar axes at the right
void setColorPalette(int pal)
palette for plotting an image
void setAutoImageRange(bool __value)
indicates whether to estimate min/max of the image automatically
class to plot an image from an 2-dimensional array of values stored in a column of the datastore
Definition jkqtpimage.h:771
virtual void setImageColumn(int __value)
column containing the displayed image
void setAxisLabel(const QString &__value)
axis label of the axis
This class manages data columns (with entries of type double ), used by JKQTPlotter/JKQTBasePlotter t...
Definition jkqtpdatastorage.h:282
void setHeight(double __value)
height of image
void setX(double __value)
x coordinate of lower left corner
void setWidth(double __value)
width of image
void setY(double __value)
y coordinate of lower left corner
virtual void setTitle(const QString &title) override
sets the title of the plot (for display in key!).
plotter widget for scientific plots (uses JKQTBasePlotter to do the actual drawing)
Definition jkqtplotter.h:364
void zoomToFit(bool zoomX=true, bool zoomY=true, bool includeX0=false, bool includeY0=false, double scaleX=1.05, double scaleY=1.05)
this method zooms the graph so that all plotted datapoints are visible.
Definition jkqtplotter.h:1039
JKQTPVerticalAxisBase * getYAxis(JKQTPCoordinateAxisRef axis=JKQTPPrimaryAxis)
returns the y-axis objet of the plot
Definition jkqtplotter.h:713
JKQTBasePlotter * getPlotter()
returns the JKQTBasePlotter object internally used for plotting
Definition jkqtplotter.h:404
void addGraph(JKQTPPlotElement *gr)
Definition jkqtplotter.h:784
JKQTPDatastore * getDatastore()
returns a pointer to the datastore used by this object
Definition jkqtplotter.h:611
JKQTPHorizontalAxisBase * getXAxis(JKQTPCoordinateAxisRef axis=JKQTPPrimaryAxis)
returns the x-axis objet of the plot
Definition jkqtplotter.h:711
size_t JKQTPCopyCImgToColumn(JKQTPDatastore *datastore, const cimg_library::CImg< T > &img, const QString &name=QString(""), int channel=0, int z=0)
add one external column to the datastore. It will be filled with the contents of the CImg image img.
Definition jkqtpinterfacecimg.h:42
@ JKQTPMathImageMATLAB
Definition jkqtpbasicimagetools.h:101

The result looks like this:

imageplot

See examples/imageplot for a detailed description of the other possibilities that the class JKQTPColumnMathImage (and also JKQTPMathImage) offer with respect to determining how an image is plottet.