JKQTPlotter trunk/v5.0.0
an extensive Qt5+Qt6 Plotter framework (including a feature-richt plotter widget, a speed-optimized, but limited variant and a LaTeX equation renderer!), written fully in C/C++ and without external dependencies
Loading...
Searching...
No Matches
Example (JKQTPlotter): Simple math image plot

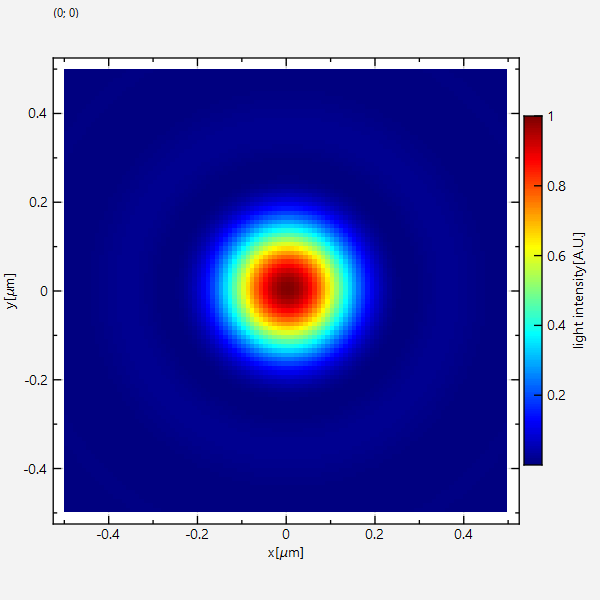
This project (see ./examples/imageplot/) simply creates a JKQTPlotter widget (as a new window) and adds a color-coded image plot of a mathematical function (here the Airy disk). The image is stored as a simple C-array in row-major ordering and then copied into a single column of the internal datastore (JKQTPMathImage could be directly used without the internal datastore). This very simple interface can also be used to interface with many common image processing libraries, like CImg or OpenCV.

The source code of the main application is (see imageplot.cpp:

#include <QApplication>
#include <cmath>
#include "jkqtplotter/jkqtplotter.h"
#include "jkqtplotter/graphs/jkqtpimage.h"
#ifndef M_PI
#define M_PI 3.14159265358979323846
#endif
int main(int argc, char* argv[])
{
QApplication app(argc, argv);
// 1. create a plotter window and get a pointer to the internal datastore (for convenience)
plot.getPlotter()->setUseAntiAliasingForGraphs(true); // nicer (but slower) plotting
plot.getPlotter()->setUseAntiAliasingForSystem(true); // nicer (but slower) plotting
plot.getPlotter()->setUseAntiAliasingForText(true); // nicer (but slower) text rendering
// 2. now we create data for the charts (taken from https://commons.wikimedia.org/wiki/File:Energiemix_Deutschland.svg)
const int NX=100; // image dimension in x-direction [pixels]
const int NY=100; // image dimension in x-direction [pixels]
const double dx=1e-2; // size of a pixel in x-direction [micrometers]
const double dy=1e-2; // size of a pixel in x-direction [micrometers]
const double w=static_cast<double>(NX)*dx;
const double h=static_cast<double>(NY)*dy;
double airydisk[NX*NY]; // row-major image
// 2.1 Parameters for airy disk plot (see https://en.wikipedia.org/wiki/Airy_disk)
double NA=1.1; // numerical aperture of lens
double wavelength=488e-3; // wavelength of the light [micrometers]
// 2.2 calculate image of airy disk in a row-major array
double x, y=-h/2.0;
for (int iy=0; iy<NY; iy++ ) {
x=-w/2.0;
for (int ix=0; ix<NX; ix++ ) {
const double r=sqrt(x*x+y*y);
const double v=2.0*M_PI*NA*r/wavelength;
airydisk[iy*NX+ix] = pow(2.0*j1(v)/v, 2);
x+=dx;
}
y+=dy;
}
// 3. make data available to JKQTPlotter by adding it to the internal datastore.
// In this step the contents of C-array airydisk is copied into a column
// of the datastore in row-major order
size_t cAiryDisk=ds->addCopiedImageAsColumn(airydisk, NX, NY, "imagedata");
// 4. create a graph (JKQTPColumnMathImage) with the column created above as data
// The data is color-coded with the color-palette JKQTPMathImageMATLAB
// the converted range of data is determined automatically because setAutoImageRange(true)
graph->setTitle("");
// image column with the data
graph->setImageColumn(cAiryDisk);
// set size of the data (the datastore does not contain this info, as it only manages 1D columns of data and this is used to assume a row-major ordering
graph->setNx(NX);
graph->setNy(NY);
// where does the image start in the plot, given in plot-axis-coordinates (bottom-left corner)
graph->setX(-w/2.0);
graph->setY(-h/2.0);
// width and height of the image in plot-axis-coordinates
graph->setWidth(w);
graph->setHeight(h);
// color-map is "MATLAB"
// get coordinate axis of color-bar and set its label
graph->getColorBarRightAxis()->setAxisLabel("light intensity [A.U.]");
// determine min/max of data automatically and use it to set the range of the color-scale
graph->setAutoImageRange(true);
// 5. add the graphs to the plot, so it is actually displayed
plot.addGraph(graph);
// 6. set axis labels
plot.getXAxis()->setAxisLabel("x [{\\mu}m]");
plot.getYAxis()->setAxisLabel("y [{\\mu}m]");
// 7. fix axis and plot aspect ratio to 1
// 8 autoscale the plot so the graph is contained
plot.zoomToFit();
// show plotter and make it a decent size
plot.show();
plot.resize(600,600);
plot.setWindowTitle("JKQTPColumnMathImage");
return app.exec();
}
void setMaintainAspectRatio(bool value)
en-/disables the maintaining of the data aspect ratio
void setUseAntiAliasingForSystem(bool __value)
specifies whether to use antialiasing for plotting the coordinate system
void setMaintainAxisAspectRatio(bool value)
en-/disables the maintaining of the axis aspect ratio
void setUseAntiAliasingForGraphs(bool __value)
specifies whether to use antialiasing for plotting the graphs
void setUseAntiAliasingForText(bool __value)
specifies whether to use antialiasing when drawing any text
JKQTPVerticalIndependentAxis * getColorBarRightAxis()
object used for color bar axes at the right
void setColorPalette(int pal)
palette for plotting an image
void setAutoImageRange(bool __value)
indicates whether to estimate min/max of the image automatically
class to plot an image from an 2-dimensional array of values stored in a column of the datastore
Definition jkqtpimage.h:771
virtual void setImageColumn(int __value)
column containing the displayed image
void setAxisLabel(const QString &__value)
axis label of the axis
This class manages data columns (with entries of type double ), used by JKQTPlotter/JKQTBasePlotter t...
Definition jkqtpdatastorage.h:282
size_t addCopiedImageAsColumn(const T *data, size_t width, size_t height, const QString &name=QString(""), size_t stride=1, size_t start=0)
add one external column to the datastore. It contains width * height rows. The external data is assum...
Definition jkqtpdatastorage.h:2831
void setHeight(double __value)
height of image
void setX(double __value)
x coordinate of lower left corner
void setWidth(double __value)
width of image
void setY(double __value)
y coordinate of lower left corner
void setNy(int __value)
height of the data array data in pt
void setNx(int __value)
width of the data array data in pt
virtual void setTitle(const QString &title) override
sets the title of the plot (for display in key!).
plotter widget for scientific plots (uses JKQTBasePlotter to do the actual drawing)
Definition jkqtplotter.h:364
void zoomToFit(bool zoomX=true, bool zoomY=true, bool includeX0=false, bool includeY0=false, double scaleX=1.05, double scaleY=1.05)
this method zooms the graph so that all plotted datapoints are visible.
Definition jkqtplotter.h:1039
JKQTPVerticalAxisBase * getYAxis(JKQTPCoordinateAxisRef axis=JKQTPPrimaryAxis)
returns the y-axis objet of the plot
Definition jkqtplotter.h:713
JKQTBasePlotter * getPlotter()
returns the JKQTBasePlotter object internally used for plotting
Definition jkqtplotter.h:404
void addGraph(JKQTPPlotElement *gr)
Definition jkqtplotter.h:784
JKQTPDatastore * getDatastore()
returns a pointer to the datastore used by this object
Definition jkqtplotter.h:611
JKQTPHorizontalAxisBase * getXAxis(JKQTPCoordinateAxisRef axis=JKQTPPrimaryAxis)
returns the x-axis objet of the plot
Definition jkqtplotter.h:711
@ JKQTPMathImageMATLAB
Definition jkqtpbasicimagetools.h:101

The result looks like this:

imageplot

There are several ways to modify the plot:

  1. You can set the color scale manually (here 0..2), by using

    graph->setAutoImageRange(false); graph->setImageMin(0); graph->setImageMax(2);

    instead of

    graph->setAutoImageRange(true);

    from above. The result will look like this:
    imageplot__scale02
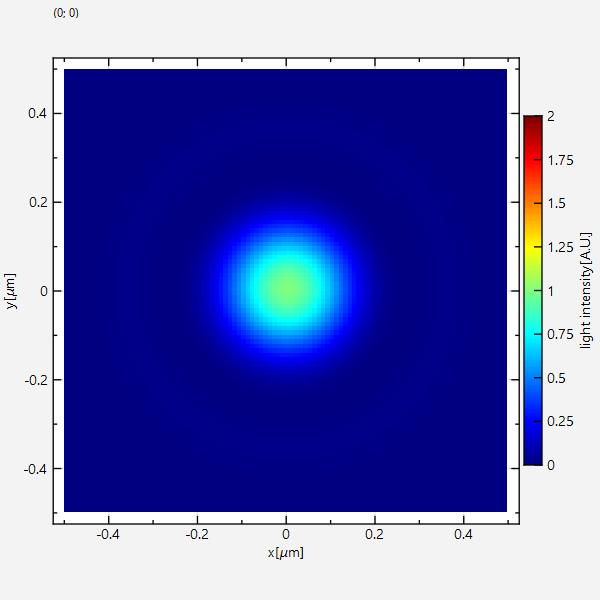
    Note how the color scale is not used completely, because data really only scales between 0 and 1.

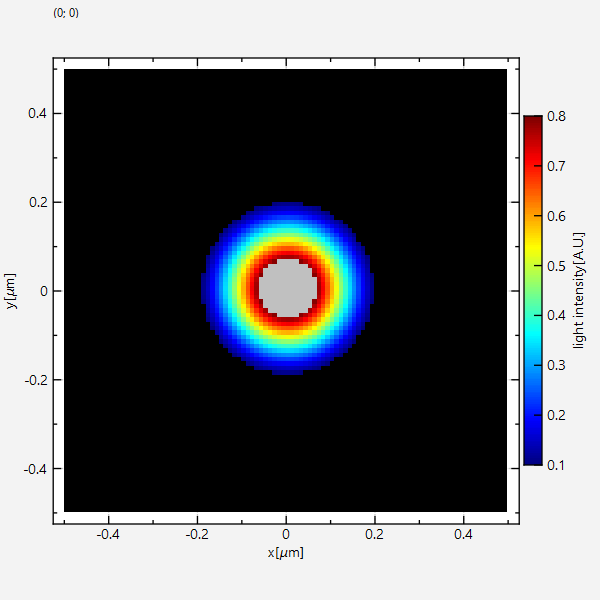
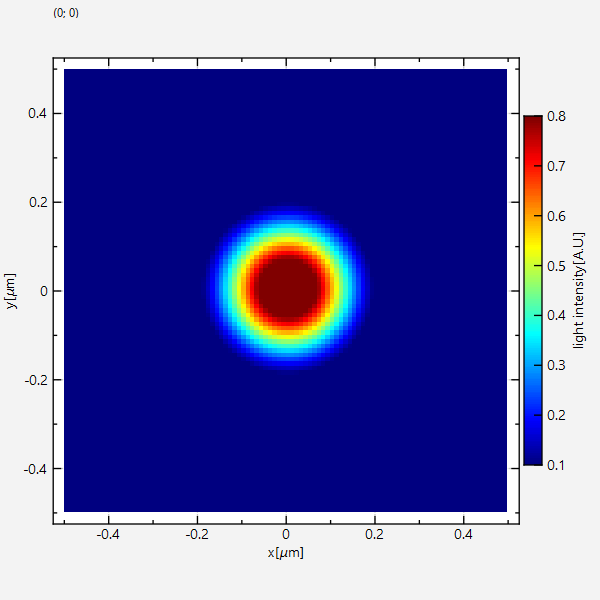
  2. If you set the color-range to 0.1 .. 0.8 with graph->setAutoImageRange(false); graph->setImageMin(0.1); graph->setImageMax(0.8);

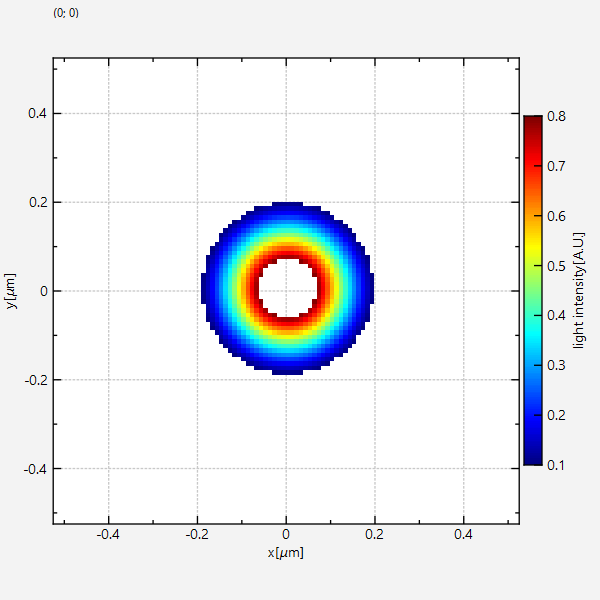
    Then there will be datapoints above or below the range of the colorscale. The default behaviour of the graph is to use the first color of the palette for every pixel with a value below the minimum (here 0.1) and the last color in the palette for every pixel with a value above the maximum.

    imageplot__smallscalelimitcolor

    You can change this behaviour by JKQTPColumnMathImage::setRangeMinFailAction() / JKQTPColumnMathImage::setRangeMaxFailAction() with one of these parameters:

    • JKQTPMathImageLastPaletteColor: the default behaviour explained above
    • JKQTPMathImageGivenColor: use a color set by setRangeMinFailColor(),setRangeMaxFailColor() (here e.g. black for min and grey for max)
      imageplot__smallscalecolor
    • JKQTPMathImageTransparent: draw pixels transparent
      imageplot__smallscaletransparent