|
JKQTPlotter trunk/v5.0.0
an extensive Qt5+Qt6 Plotter framework (including a feature-richt plotter widget, a speed-optimized, but limited variant and a LaTeX equation renderer!), written fully in C/C++ and without external dependencies
|
|
JKQTPlotter trunk/v5.0.0
an extensive Qt5+Qt6 Plotter framework (including a feature-richt plotter widget, a speed-optimized, but limited variant and a LaTeX equation renderer!), written fully in C/C++ and without external dependencies
|
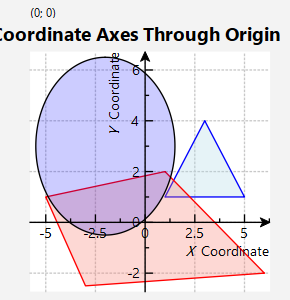
This example draws a coordinate system with several geomtric shapes, where the coordinate axes pass through the origin of the plot, not at the borders. Note that if you move the displayed coordinate ranges, so 0 is not in them, the axes still stick to the borders.
The source code of the main application can be found in geo_coordinateaxis0.cpp.
Apart from the usual code to set up the graphs, the following fragment switches the "normal" axes at the borders off and the zero axis on:
The axes are configured to have an arrow at their max end (|JKQTPCADMMaxFilledArrow) and the axis label is also positioned close to the axis max.
The resulting plot looks like this: