|
JKQTPlotter trunk/v5.0.0
an extensive Qt5+Qt6 Plotter framework (including a feature-richt plotter widget, a speed-optimized, but limited variant and a LaTeX equation renderer!), written fully in C/C++ and without external dependencies
|
|
JKQTPlotter trunk/v5.0.0
an extensive Qt5+Qt6 Plotter framework (including a feature-richt plotter widget, a speed-optimized, but limited variant and a LaTeX equation renderer!), written fully in C/C++ and without external dependencies
|
This project (see ./examples/functionplot/) demonstrates how to plot mathematical functions as line graphs. The functions may be defined as static C functions, C++ functors or c++ inline functions. See examples/parsedfunctionplot for an example of how to use an internal equation parser provided with JKQTPlotter instead of directly defining functions.
The first example shows how to plot a C++ inline function:
In any such plot function, you can also use parameters, provided via the second parameter. Usually these are "internal parameters", defined by func2->setParamsV(p0, p1, ...):
You can also use C++ functors (or function objects):
You can also plot simple static C functions:
Finally JKQTPXFunctionLineGraph provides a small set of special functions (polynomial p0+p1*x+p2*x^2+..., exponential p0+p1*exp(x/p2), power-law p0+p1*x^p2, ...), which are parametrized from the internal or external parameters:
To demonstrate how to use parameters from a datastore column, have a look at the next example. It is derived from the special-function plot above, but adds a line with a different offset and slope and reads the parameters from a datastore column paramCol, which is initialized from the vector params:
This code snippets above result in a plot like this:
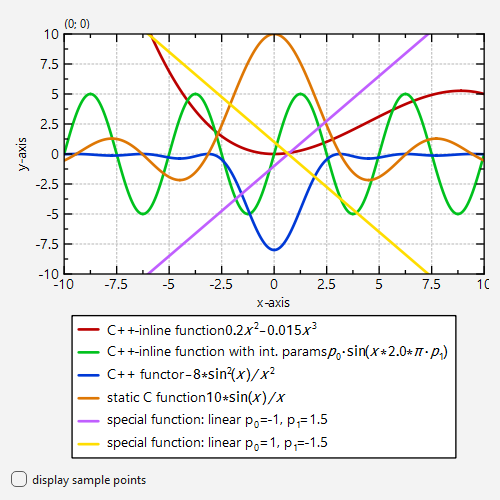
Note that all the different variants to provide parameters can be used with all types of functions!
Also see the example Plotting Parsed Mathematical Functions as Line Graphs for details on how the actual plotting algorithm works. That example also shows how to define a function as a string, which is then parsed and evaluated by an expression parser library embedded in JKQTPlotter.
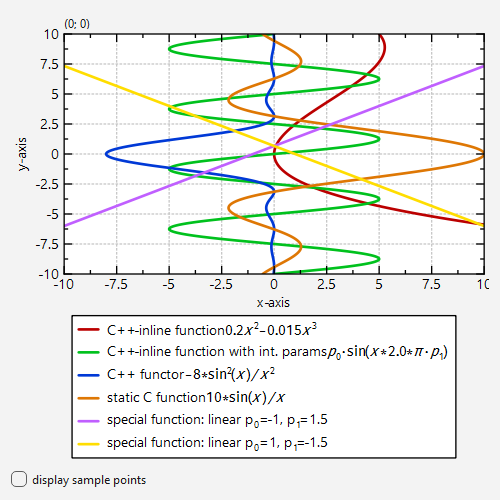
All examples above use the graph class JKQTPXFunctionLineGraph, which plots a function y=f(x). If you want to plot a function x=f(y), you can use the class JKQTPYFunctionLineGraph instead. If in the examples above, we exchange all JKQTPXFunctionLineGraph for JKQTPYFunctionLineGraph, the graphs will be rotated by 90 degree, as all functions are interpreted as x=f(y):
This example describes how to draw 1D functions. For an example of how to draw 2D parametric curves [x,y]=f(t), see examples/evalcurve .