This project (see ./examples/contourplot/) shows how to draw contour plots with JKQTPlotter.
Drawing a Contour Plot
The source code of the main application is (see contourplot.cpp ).
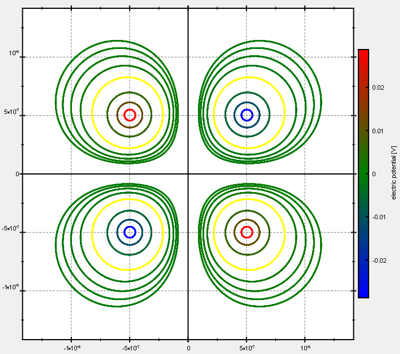
First the electric potential from a quadrupole is calculated and stored in an image column inside the JKQTPDatastore:
const int NX=500;
const int NY=500;
const double w=2.7e-6;
const double dx=w/static_cast<double>(NX);
const double h=NY*dx;
double x;
double y=-h/2.0;
const double eps0=8.854187e-12;
const double Q1=1.6e-19;
const double Q1_x0=-0.5e-6;
const double Q1_y0=-0.5e-6;
const double Q2=1.6e-19;
const double Q2_x0=0.5e-6;
const double Q2_y0=0.5e-6;
const double Q3=-1.6e-19;
const double Q3_x0=-0.5e-6;
const double Q3_y0=0.5e-6;
const double Q4=-1.6e-19;
const double Q4_x0=0.5e-6;
const double Q4_y0=-0.5e-6;
for (size_t iy=0; iy<NY; iy++ ) {
x=-w/2.0;
for (size_t ix=0; ix<NX; ix++ ) {
const double r1=sqrt((x-Q1_x0)*(x-Q1_x0)+(y-Q1_y0)*(y-Q1_y0));
const double r2=sqrt((x-Q2_x0)*(x-Q2_x0)+(y-Q2_y0)*(y-Q2_y0));
const double r3=sqrt((x-Q3_x0)*(x-Q3_x0)+(y-Q3_y0)*(y-Q3_y0));
const double r4=sqrt((x-Q4_x0)*(x-Q4_x0)+(y-Q4_y0)*(y-Q4_y0));
ds->
setPixel(cPotential, ix, iy, Q1/(4.0*M_PI*eps0)/r1+Q2/(4.0*M_PI*eps0)/r2+Q3/(4.0*M_PI*eps0)/r3+Q4/(4.0*M_PI*eps0)/r4);
x+=dx;
}
y+=dx;
}
This class manages data columns (with entries of type double ), used by JKQTPlotter/JKQTBasePlotter t...
Definition jkqtpdatastorage.h:282
size_t addImageColumn(size_t width, size_t height, const QString &name=QString(""))
add a new columns with width * height rows to the datastore and return its column ID....
void setPixel(size_t column, size_t x, size_t y, double value)
returns the value at position (x, y) in the column-th column, which is interpreted with the imageWidt...
Definition jkqtpdatastorage.h:2908
Then this image column can be drawn with a JKQTPColumnContourPlot:
QVector<double> reldists; reldists<<0.1<<0.25<<0.5<<1<<1.5<<2<<2.5<<3;
for (auto reldist: reldists) {
const double level=fabs(Q1/(4.0*M_PI*eps0)/(Q1_x0*reldist));
}
class for a contour plots (same as JKQTPContourPlot) of images stored in a JKQTPDatastore column
Definition jkqtpcontour.h:253
void setImageColumn(int __value)
column containing the displayed image
void addContourLevel(double level)
add another level for which to draw a contour
QVector< double > getContourLevels() const
the list of contour levels
void setAxisLabel(const QString &__value)
axis label of the axis
void setHeight(double __value)
height of image
void setX(double __value)
x coordinate of lower left corner
void setWidth(double __value)
width of image
void setY(double __value)
y coordinate of lower left corner
virtual void setTitle(const QString &title) override
sets the title of the plot (for display in key!).
Note that we created the list of contour levels to draw explicitly here using JKQTPColumnContourPlot::addContourLevel(). There are also methods JKQTPColumnContourPlot::createContourLevels() and JKQTPColumnContourPlot::createContourLevelsLog() to auto-generate these from the data-range with linear or logarithmic spacing, but both options do not yield good results here. The code above generates these contour levels:
-0.0287602, -0.0115041, -0.00575203, -0.00287602, -0.00191734, -0.00143801, -0.00115041, -0.000958672, 0.000958672, 0.00115041, 0.00143801, 0.00191734, 0.00287602, 0.00575203, 0.0115041, 0.0287602
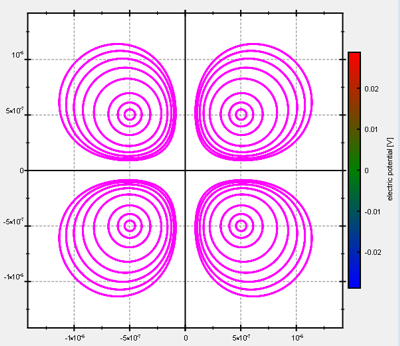
The result looks like this:
Styling a Contour Plot
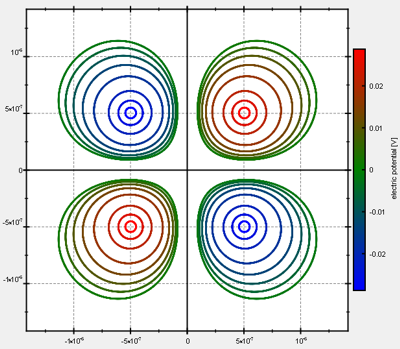
You can change the way that the colors for the contours are chosen by calling JKQTPColumnContourPlot::setContourColoringMode() with another mode:
In all modes you can override the coloring of single levels by calling JKQTPColumnContourPlot::setOverrideColor(level, color). In the example above this looks like this:
for (auto reldist: reldists) {
const double level=fabs(Q1/(4.0*M_PI*eps0)/(Q1_x0*reldist));
if (reldist==1) {
}
}
void setOverrideColor(double level, QColor overrideColor)
define an override color for the contour line at the given level
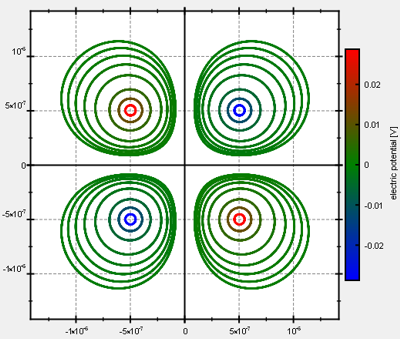
This code results (in the default coloring mode JKQTPColumnContourPlot::ColorContoursFromPaletteByValue) in:
Gimmick: Animating a Contour Plot
In order to demonstrate the caching implemented in the contour plot, there is optional animation code inside this example, in the form of the class ContourPlotAnimator (see (see ContourPlotAnimator.cpp ).
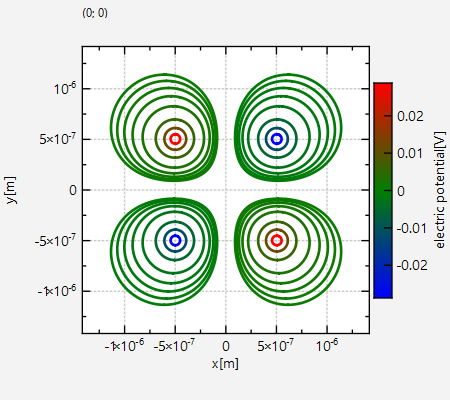
The code therein results in an animation like this:
Note that zooming can still be perfomred without the need to recalculate the contour lines.